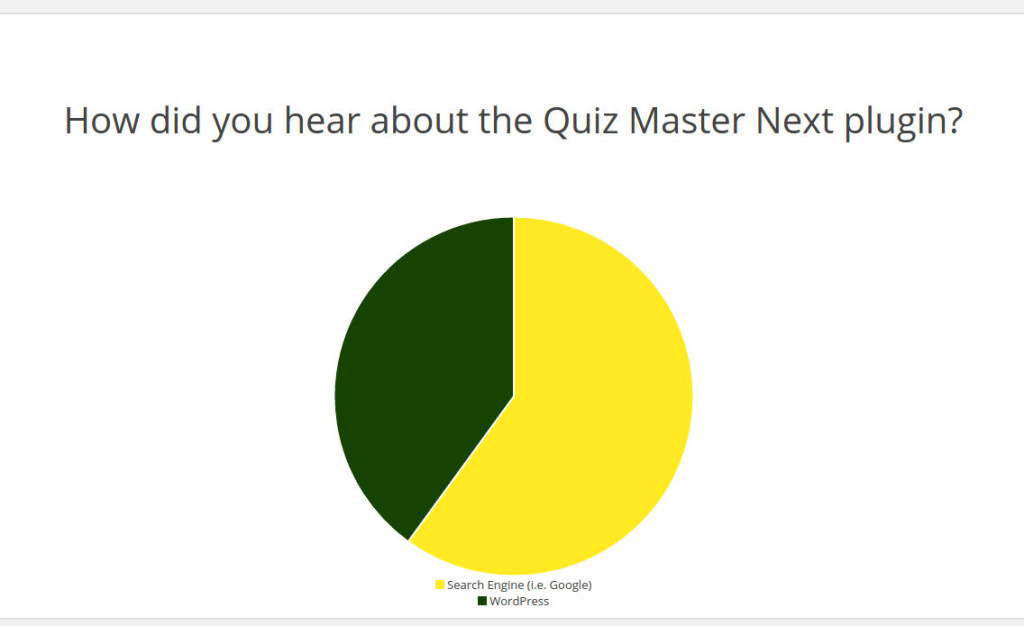
There are many times when you will want to aggregate your results into useful charts and data. Perhaps you want to see how many people answered “Yes” and how many answered “No” on one of your questions. With our latest addon, you can do just that.
Results Analysis allows you to analyze a quiz’s results to see what percentage of users selected each answer of each question. You can also see the average scores and total submissions. While that is useful itself, what really makes this addon amazing is its ability to filter the data. For example, you can filter the date range of the results. This is useful if you wanted to compare last month’s results of your customer satisfaction survey with this month’s. You can also filter by user, business, or name.
Even better, you can use multiple filters. An example would be if you give surveys to employees of different businesses. You can see how different businesses survey answers have changed over time by using the business filter in addition to the date range filter. If you are giving graded quizzes and tests, you can use the date range filter to see how the scores of a certain quiz change over time.
This is a great addon for anyone looking to analyze and aggregate the data from the results. So, be sure to check it out today!


